B2B SaaS GEO: How to Measure Category Visibility Without Overclaiming
A practical B2B SaaS GEO framework for building category prompts, checking AI product recommendations, preserving answer evidence, and separating visibility from pipeline.
The short answer
B2B SaaS GEO should start with the questions buyers ask before they know your brand, not only branded prompts. Build a stable panel of category, comparison, alternative, integration, security, and objection queries; capture complete answers and sources; then report visibility, citations, referrals, and pipeline as separate evidence layers.
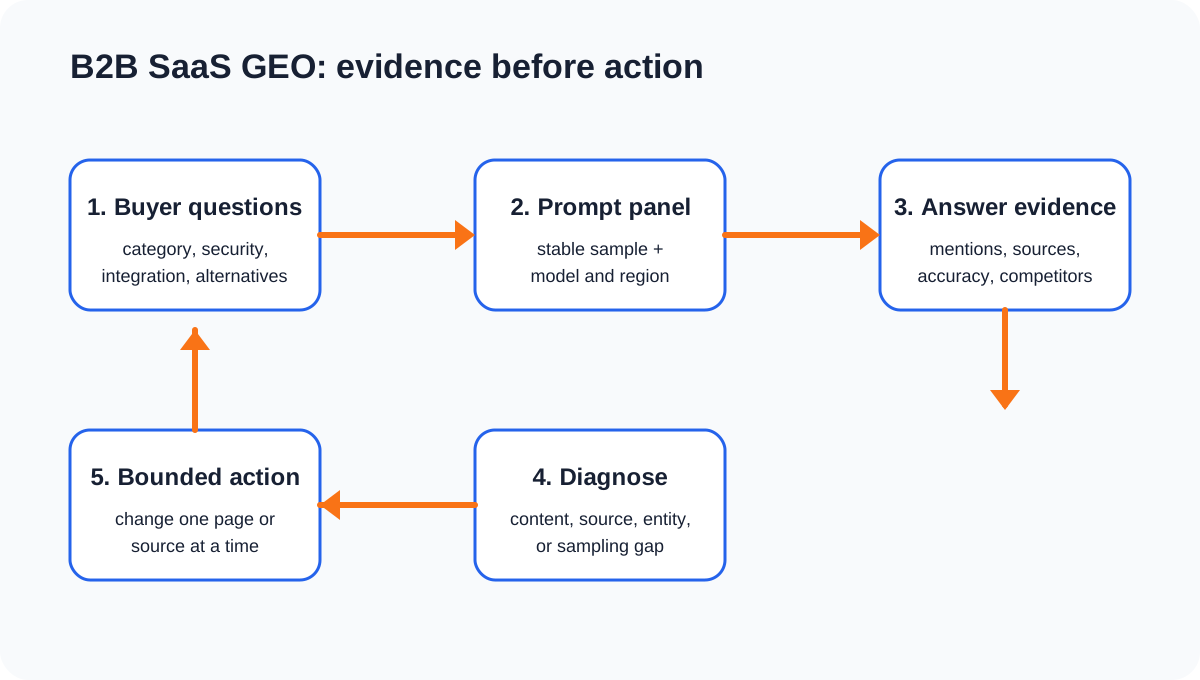
The practical chain is:
buyer question → prompt panel → answer evidence → source/content diagnosis → bounded change → retestA higher mention rate does not by itself prove more qualified pipeline. The same discipline applies whether the team uses a specialist platform such as GrackerAI, Profound, or a general monitoring tool.
Why B2B SaaS prompts are different
A consumer query may ask for a product recommendation directly. B2B SaaS buyers often move through a longer evaluation path:
- What tools solve a specific operational problem?
- Which products integrate with our existing stack?
- Which vendors meet a security or compliance requirement?
- What is the best alternative to a known platform?
- Which product is suitable for a company of our size?
- What are the implementation and migration tradeoffs?
AI answers can compress those stages into one response. That makes the answer useful to inspect, but difficult to interpret as a stable ranking. A single response is a sample from a model, retrieval system, date, location, and prompt context—not a complete measurement of category demand.
For broader metric boundaries, see AI Visibility vs AI Citations vs AI Traffic.
1. Build a B2B SaaS prompt taxonomy
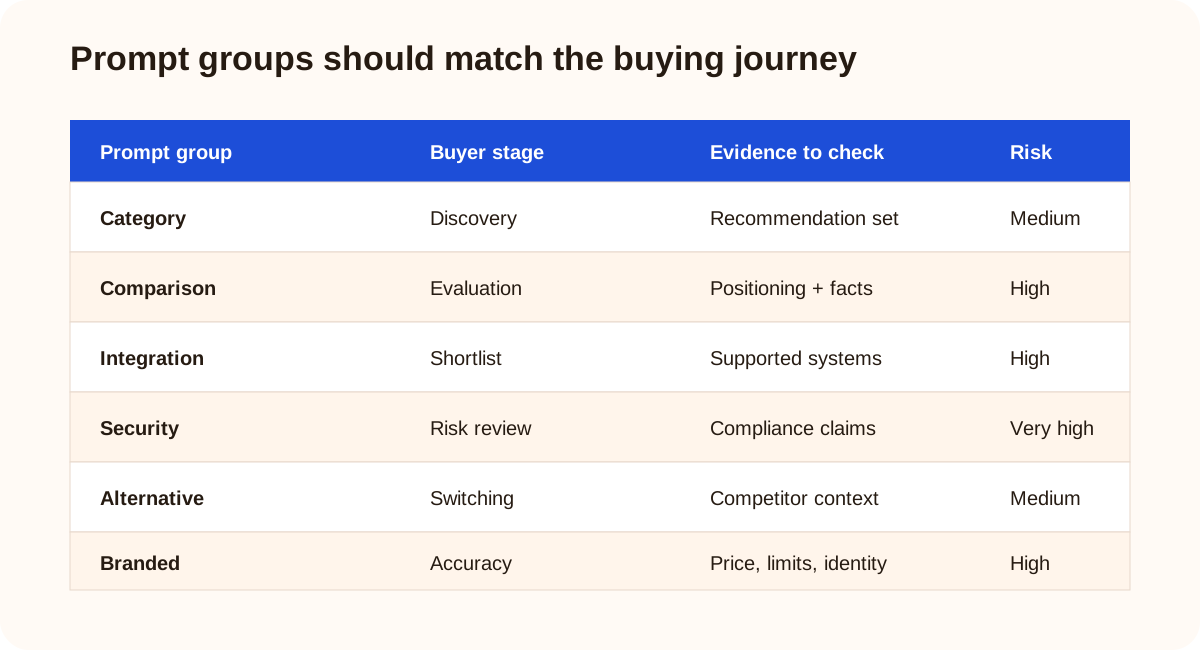
A balanced panel should represent the buying journey. Do not let easy branded prompts dominate the score.
| Prompt group | Example intent | What to inspect |
|---|---|---|
| Problem | “How do teams manage X?” | Whether the category and use case are understood |
| Category | “Best tools for X” | Recommendation presence and competitor set |
| Comparison | “A vs B for a mid-market team” | Positioning, differentiators, and factual accuracy |
| Alternative | “Alternatives to A” | Whether the brand appears when a buyer is already evaluating |
| Integration | “Tools that integrate with Y” | Integration facts and outdated capability claims |
| Security | “SOC 2 / SSO / data residency tools for X” | High-risk factual claims and citations |
| Evaluation | “What should I look for in X software?” | Whether useful educational content is surfaced |
| Regional | “Best X software in the UK” | Country, language, and market differences |
| Branded | “What does Brand do?” | Accuracy, current pricing, limits, and identity |
A useful first panel might contain 40–100 prompts, but the correct size depends on the market and the tool’s quota. The denominator must always be visible in reporting.
Keep the panel versioned
Record prompt text, intent group, competitor list, model or surface, country, language, date, and sampling frequency. If you replace half the prompts, a before-and-after score is not a clean time series anymore.
2. Capture answer-level evidence
A dashboard percentage is a summary. The underlying answer is the evidence a content or product-marketing team can actually review.
For each run, preserve where possible:
- Complete answer text or a durable capture.
- Prompt and prompt-group identifier.
- Engine, model, country, language, and timestamp.
- Mentioned brands and recommendation order.
- Source URLs, domains, and cited page position.
- Statements about features, integrations, pricing, security, and limits.
- Accuracy notes and reviewer decisions.
Tools differ in what they expose. GrackerAI publishes prompt and engine limits but buyers should verify raw-answer export during a trial. PromptWatch is a better comparison point when crawler and referral analytics are central. Rankscale is relevant when broad engine coverage matters more than a vertical B2B focus.
3. Score observations, not promises
A practical observation table might look like this:
| Observation | Evidence | Safe interpretation |
|---|---|---|
| Brand mentioned | Captured answer | Brand appeared in this sample |
| Brand recommended | Answer position and wording | The model recommended it in this context |
| Domain cited | Visible source URL | The domain was linked or named |
| Feature described | Answer text compared with product facts | The model’s description can be checked for accuracy |
| Referral recorded | Analytics session with a detectable AI source | A visit was attributed under that analytics setup |
| Pipeline influenced | CRM record and explicit attribution model | A business event was associated, not necessarily caused |
Do not turn the first four rows into the last two. A citation is not a click, and a click is not causal revenue evidence.
4. Diagnose the missing signal
When a competitor appears more often, ask what kind of gap the answer reveals.
Entity or identity gap
The model confuses the product with another brand, uses an outdated company description, or cannot distinguish a product from its parent company. Check consistent naming, first-party documentation, reputable profiles, and structured data. Structured data can clarify machine-readable facts, but it does not force an AI answer.
Content gap
The company page does not clearly answer the prompt. A comparison page may omit the use case, buyer size, limitations, integration details, or evidence. Improve the page for people first, with specific claims and sourceable facts.
Source gap
The model repeatedly cites independent reviews, directories, communities, or publisher pages instead of the company’s domain. That is a source and authority observation—not proof that publishing more pages alone will change the answer. Review third-party accuracy and pursue appropriate editorial or PR work.
Accuracy gap
The answer gives the wrong price, plan limit, compliance claim, or integration. Separate a harmful falsehood from an accurate negative statement. The action may involve updating first-party pages, documentation, structured data, or third-party listings.
Sampling gap
Only one answer changed, the model changed, or the prompt was ambiguous. Continue sampling before assigning a large content project.
5. Run a bounded experiment
A defensible B2B SaaS GEO experiment changes one meaningful variable:
- Freeze the prompt panel and competitor definitions.
- Capture a baseline over multiple runs when possible.
- Choose one action, such as improving an integration page or correcting a pricing fact.
- Record the publication date and other marketing events.
- Re-run the same prompts and environment for a defined window.
- Compare complete answers, citations, accuracy, and competitors.
- Check detectable referrals separately in analytics and CRM.
A careful conclusion could be:
After the integration page was clarified, the brand appeared in more responses in the defined prompt panel over four weekly samples. The observation is encouraging, but it does not isolate causation or establish additional pipeline.
That statement is more useful than “the page increased AI rankings by 35%.”
Choosing a tool for the workflow
Choose by measurement job rather than by the largest feature list.
| Need | Questions to ask | Example fit |
|---|---|---|
| Vertical B2B SaaS visibility | Are SaaS and cybersecurity prompts first-class? Are limits clear? | GrackerAI |
| Enterprise intelligence | Can the team manage large prompt sets, sources, and governance? | Profound |
| Crawler and referral analysis | Does it inspect logs, analytics, or both? | PromptWatch |
| Broad monitoring | Which engines, regions, and exports are included? | Rankscale |
| Content execution | Does the tool support briefs, optimization, and publishing? | Frase or Surfer AI Tracker |
For every product, verify plan-specific engine coverage, prompt accounting, historical retention, answer export, API limits, language and region support, and whether a cited URL is available for review.
What B2B SaaS GEO does not prove
A prompt program cannot establish:
- Total AI search demand.
- A universal rank across all models and users.
- Guaranteed mentions, recommendations, or citations.
- That a content edit caused a model change.
- That AI visibility produced a qualified visit.
- That an AI-attributed visit caused revenue.
Use analytics and CRM data for the later stages, with an explicit attribution model. Even then, observed association is not automatically causal proof.
A practical monthly report
A client or leadership report can use four sections:
Scope
Prompt version, intent groups, engines, models, locations, languages, date window, sample size, and exclusions.
Answer observations
Mention rate, recommendation rate, competitor presence, citations, cited domains, and accuracy issues—each with a denominator and examples.
Actions
Content, product-marketing, PR, technical, or data corrections. Assign an owner and expected retest date.
Business metrics
Detectable AI referrals, landing pages, engagement, leads, opportunities, and revenue under the chosen analytics/CRM rules. Keep this section separate from visibility.
Checklist
- Prompts cover category, comparison, alternatives, integrations, security, and objections.
- Branded prompts are not the whole sample.
- Prompt, model, region, language, date, and denominator are recorded.
- Complete answers and source URLs are retained where possible.
- Visibility, citation, referral, pipeline, and revenue are separate.
- One bounded action is tested at a time.
- Vendor-selected case studies are labeled as such.
- Pricing and plan limits are checked on the current official page.
- The report states what the sample cannot prove.
FAQ
How many B2B SaaS prompts should we monitor?
Use enough prompts to cover the buying journey and important markets, then make the denominator explicit. A smaller, stable panel is more useful for trend analysis than a large undocumented list.
Should branded prompts be included?
Yes, for brand accuracy and product-fact monitoring. They should not dominate category visibility claims because they make the brand’s appearance more likely.
Is being recommended better than being cited?
They answer different questions. Recommendation wording describes the answer’s framing; citation identifies a visible source relationship. Capture both and check whether the facts are accurate.
Can GEO prove B2B SaaS pipeline?
No. GEO tools can provide sampled answer observations and some platforms can connect to referral or analytics data. Pipeline requires separate web analytics, CRM definitions, and an attribution model.
What is the first page a SaaS team should improve?
Start with the page tied to a repeated, high-value gap: a category page, comparison page, integration page, security page, or product documentation page. Retest the same prompt set after the change.
Sources and verification
- GrackerAI homepage — official B2B SaaS/cybersecurity positioning and product claims; checked August 19, 2026.
- GrackerAI pricing — official prompt, engine, seat, trial, and enterprise limits; checked August 19, 2026.
- Google Search Central: AI features and your website — official guidance that foundational search practices remain relevant to AI features; checked August 19, 2026.
- Google Analytics campaign URL guidance — official context for detectable campaign/referral attribution; checked August 19, 2026.
- Google Search Central: Creating helpful, reliable, people-first content — content quality and evidence context; checked August 19, 2026.
This is AICiteKit editorial guidance. It does not guarantee AI visibility, citations, rankings, traffic, pipeline, or revenue.